Learn How to Predict Stock Price Using RSI Indicator with this powerful and beginner-friendly guide. Discover RSI strategies, overbought/oversold signals, real-life case studies, and expert tips to improve your trading accuracy. This SEO-friendly article explains RSI formulas, charts, and practical methods used by professional traders. Whether you are a beginner or experienced investor, mastering RSI can help you identify profitable entry and exit points in the stock market. Start using RSI today to make smarter, data-driven trading decisions and boost your success rate in stock price prediction.
How to Predict Stock Price Using RSI Indicator क्या है?
RSI (Relative Strength Index) is a momentum indicator used to predict stock price trends by identifying overbought (above 70) and oversold (below 30) conditions. It helps traders find potential reversal points and make better buy/sell decisions based on market strength.
📥 Download Free PDF
👉 Click Here to Download [RSI Stock Prediction Guide PDF]
📊 Introduction
Stock market prediction is one of the most searched topics among beginners and professional traders alike. Among various technical indicators, How to Predict Stock Price Using RSI Indicator is considered one of the simplest yet most powerful methods. RSI (Relative Strength Index) helps traders understand whether a stock is overvalued or undervalued, making it easier to take entry and exit decisions.
In today’s fast-moving market, relying only on news or tips is risky. Instead, smart traders use indicators like RSI to analyze price movements scientifically. Whether you trade in stocks, crypto, or commodities, RSI works effectively across all markets.
This guide is specially written for FinBankingTech readers who want practical knowledge, not theory. You will learn RSI strategies, formulas, charts, real-life examples, and mistakes to avoid. We will also explore how beginners can use RSI confidently without coding or complex tools.
By the end of this article, you will not just understand RSI — you will know how to use it like a professional trader.
📈 What is RSI Indicator and How Does It Work?
RSI (Relative Strength Index) is a momentum oscillator that measures the speed and change of price movements.
- Developed by J. Welles Wilder
- Value ranges from 0 to 100
- Helps identify trend strength & reversal signals
📊 RSI Calculation Formula (Simple Table)
| Component | Formula |
|---|---|
| RS | Average Gain / Average Loss |
| RSI | 100 – (100 / (1 + RS)) |
👉 Don’t worry! You don’t need to calculate manually — platforms like
👉 TradingView automatically show RSI.
🎯 How to Predict Stock Price Using RSI Indicator?
❓ When Should You Buy a Stock Using RSI?
👉 Answer: When RSI goes below 30, the stock is considered oversold. This means the price may reverse upward, making it a good buying opportunity.
❓ When Should You Sell a Stock Using RSI?
👉 Answer: When RSI rises above 70, the stock becomes overbought. This indicates a possible price drop, making it a good selling signal.
📊 RSI Signal Interpretation Table
| RSI Level | Meaning | Action |
|---|---|---|
| 0–30 | Oversold | Buy Opportunity |
| 30–70 | Neutral | Hold |
| 70–100 | Overbought | Sell Opportunity |
How to Use RSI for Stock Prediction:
- Identify RSI levels (0–100 scale)
- Buy when RSI is below 30
- Sell when RSI is above 70
- Look for divergence signals
- Combine RSI with other indicators
- Avoid trading in sideways markets
📉 Advanced RSI Strategy (Divergence)
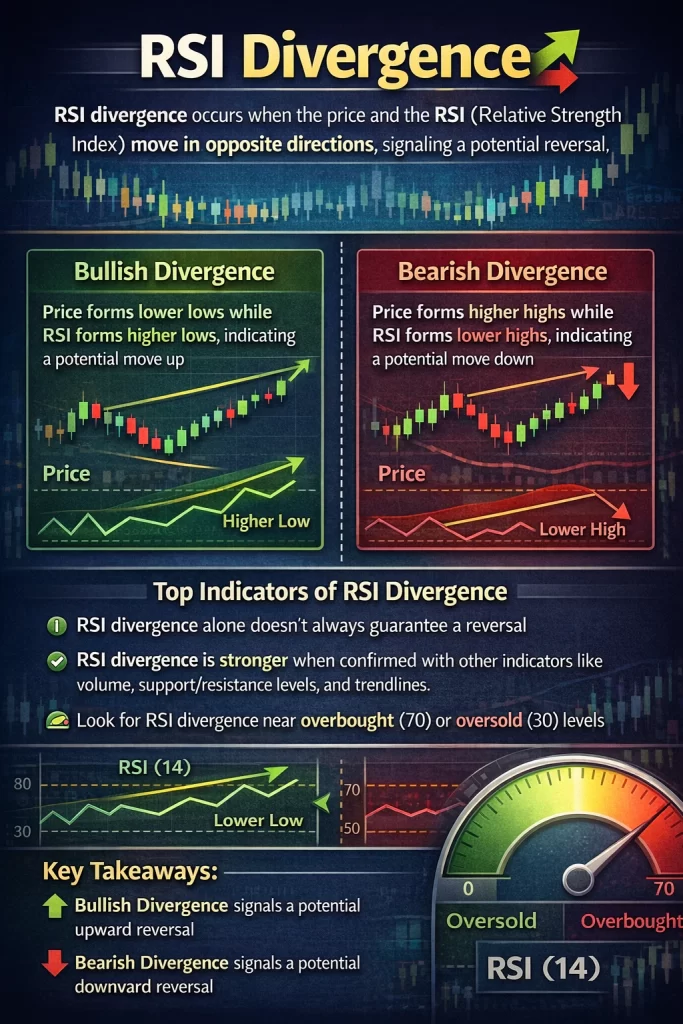
❓ What is RSI Divergence?
👉 Answer: RSI divergence occurs when stock price moves in the opposite direction of RSI. It signals a potential trend reversal.
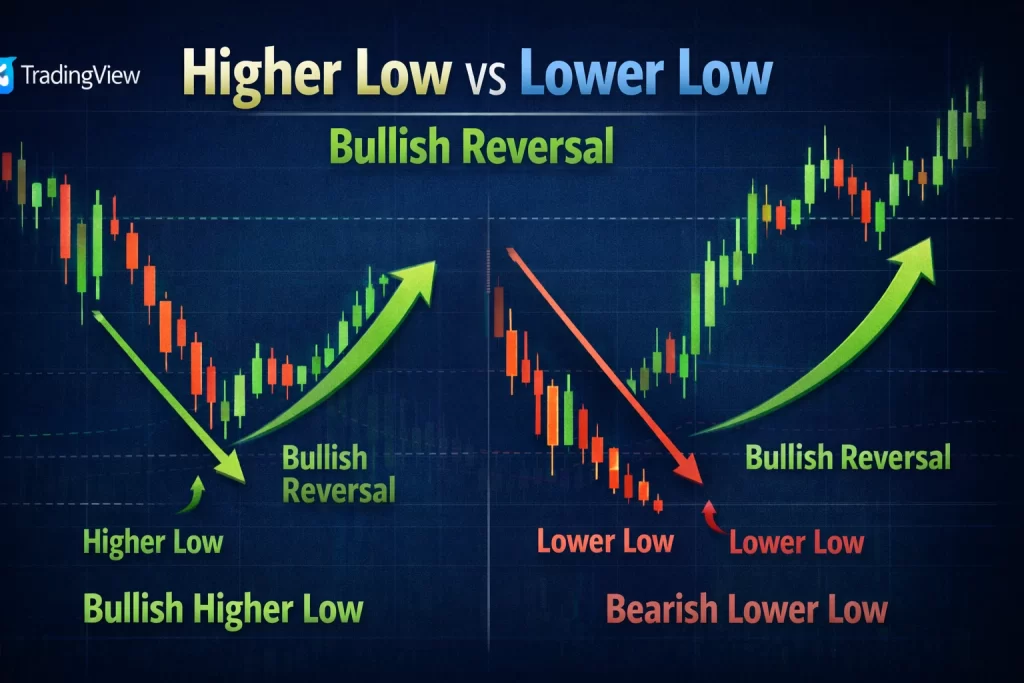
- Bullish Divergence → Price falling, RSI rising (Buy signal)
- Bearish Divergence → Price rising, RSI falling (Sell signal)
🧠 Real-Life Case Study (Powerful Story)
Ravi, a beginner trader from Lucknow, started investing in stocks without proper knowledge. He relied on tips and lost ₹15,000 in just one month.
One day, he learned about RSI through FinBankingTech. Instead of random trading, he started following a simple rule:
👉 Buy when RSI < 30
👉 Sell when RSI > 70
He applied this strategy on a stock (like Reliance Industries).
- RSI dropped to 28 → He bought shares
- After 10 days, RSI reached 72 → He sold
📈 Result: Profit of ₹4,500
Within 3 months, Ravi became consistent and avoided emotional trading. RSI didn’t make him rich overnight, but it made him disciplined — which is the real success in trading.
⚠️ Common Mistakes Traders Make
- Using RSI alone without confirmation
- Ignoring market trend
- Trading in sideways market
- Overtrading on every signal
- Not using stop loss
📊 Best RSI Settings for Different Trading Styles
| Trading Type | RSI Setting |
|---|---|
| Intraday | 9–11 |
| Swing Trading | 14 (Default) |
| Long-Term | 20–25 |
🌐 External Resource (Learn More)
👉 Official RSI Explanation:
Visit Investopedia
🔗 https://www.investopedia.com/terms/r/rsi.asp
📢 Join Our Community
📲 Telegram: https://finbankingtech.com
📲 WhatsApp: 7905455959
🌐 Website: https://finbankingtech.com
🔗 Some More:
For better SEO ranking, link this article with:
- Stock Market Basics Guide
- Best Technical Indicators
- Moving Average Strategy
- AI Stock Prediction Tools
❓ FAQs Predict Stock Price Using RSI Indicator
### What is RSI in stock market?
RSI is a momentum indicator that measures price strength and helps identify overbought or oversold conditions.
### How to predict stock price using RSI indicator?
You can predict stock trends by analyzing RSI levels. Below 30 indicates buying opportunity, above 70 indicates selling.
### Is RSI accurate for stock prediction?
RSI is reliable but should be combined with other indicators for better accuracy.
### What is best RSI setting?
14 is standard, but traders adjust based on strategy.
### Can beginners use RSI?
Yes, RSI is beginner-friendly and easy to understand.
### What happens when RSI is 80?
It indicates overbought condition and possible price correction.
### What happens when RSI is 20?
It shows oversold condition and possible upward reversal.
### Is RSI good for intraday trading?
Yes, especially with lower settings like 9 or 11.
### Can RSI predict market crash?
It can signal weakness but cannot guarantee crashes.
### What is RSI divergence?
It shows mismatch between price and RSI trend, indicating reversal.
### Is RSI better than MACD?
Both have advantages; combining them works best.
### Can RSI be used in crypto?
Yes, RSI works in all financial markets.
### What is overbought condition?
When RSI is above 70, indicating possible decline.
### What is oversold condition?
When RSI is below 30, indicating possible rise.
### How to avoid false RSI signals?
Use confirmation with trend or volume.
### Which timeframe is best for RSI?
Depends on trading style (intraday or long-term).
### Is RSI useful for long-term investors?
Yes, but better combined with fundamentals.
### Does RSI work in all market conditions?
No, it works best in trending markets.
### What indicator works best with RSI?
Moving Average and MACD.
### Is RSI free to use?
Yes, available on most trading platforms.
⚠️ Disclaimer
This article is for educational purposes only. Stock market investments are subject to market risks. Always consult a financial advisor before investing. FinBankingTech is not responsible for any financial loss.