Understanding Technical Analysis vs Fundamental Analysis: Which Predicts Stocks Better? is crucial for every investor and trader. Technical analysis studies price charts, trends, and indicators to forecast short-term price movements, while fundamental analysis evaluates financial statements, earnings, and economic factors to determine a company’s true value. Both methods play important roles in predicting stock performance. In this comprehensive guide, we explore the differences, advantages, limitations, and real-world examples of Technical Analysis vs Fundamental Analysis: Which Predicts Stocks Better? so investors can choose the right strategy for long-term investing and short-term trading decisions in today’s stock market.
Technical Analysis vs Fundamental Analysis: Which Predicts Stocks Better?
Technical Analysis vs Fundamental Analysis: Which Predicts Stocks Better? Technical analysis predicts short-term price movements by studying charts, trends, and indicators, while fundamental analysis evaluates a company’s financial health and economic factors to determine long-term value. Traders prefer technical analysis, while long-term investors rely more on fundamental analysis.
Introduction
Every investor entering the stock market eventually faces an important question: Technical Analysis vs Fundamental Analysis: Which Predicts Stocks Better?
Both methods are widely used in financial markets across the world, yet they approach stock prediction in completely different ways. Technical analysis focuses on price patterns, trends, and trading indicators, while fundamental analysis examines company earnings, revenue growth, economic conditions, and industry performance.
As of today, global stock markets including the New York Stock Exchange (NYSE), NASDAQ, and India’s National Stock Exchange (NSE) process billions of dollars in trading activity every day. Traders and investors use different analytical methods to interpret this massive flow of information.
Short-term traders often rely on technical indicators such as RSI, MACD, and moving averages to identify entry and exit points. Meanwhile, long-term investors analyze company balance sheets, earnings reports, and economic data to identify fundamentally strong stocks.
Understanding Technical Analysis vs Fundamental Analysis: Which Predicts Stocks Better? is essential because the right strategy depends on your investment horizon, risk tolerance, and financial goals.
In this detailed guide, we will explore how both approaches work, their advantages and limitations, real-world case studies, and how modern investors combine both methods to improve stock prediction accuracy.
Download PDF
Download the complete guide:
Click Here to Download [Technical Analysis vs Fundamental Analysis] PDF
What is Technical Analysis in Stock Market Prediction?
Technical analysis studies historical price data and chart patterns to predict future price movements.
It assumes that:
1 Price reflects all available information
2 Trends repeat over time
3 Market psychology influences price movements
Traders analyze charts to identify patterns such as:
-
Support and resistance levels
-
Trend lines
-
Breakouts and reversals
Technical analysis is widely used by intraday traders, swing traders, and algorithmic trading systems.
Official reference:
https://www.investopedia.com/terms/t/technicalanalysis.asp
Key Components of Technical Analysis
-
Price charts
-
Technical indicators
-
Volume analysis
-
Support and resistance levels
-
Chart patterns
What is Fundamental Analysis in Stock Investing?
Fundamental analysis evaluates the financial health and intrinsic value of a company.
It focuses on:
-
Revenue growth
-
Earnings per share (EPS)
-
Debt levels
-
Industry performance
-
Economic conditions
Investors use fundamental analysis to determine whether a stock is undervalued or overvalued.
Many long-term investors, including Warren Buffett, rely heavily on fundamental analysis.
Table: Key Differences Between Technical and Fundamental Analysis
| Feature | Technical Analysis | Fundamental Analysis |
|---|---|---|
| Focus | Price patterns and trends | Company financial health |
| Time Horizon | Short-term trading | Long-term investing |
| Tools Used | Charts, indicators | Financial statements |
| Goal | Identify entry/exit points | Determine intrinsic value |
| Popular Among | Traders | Long-term investors |
Why Do Traders Prefer Technical Analysis?
Traders prefer technical analysis because it provides clear timing signals.
Technical indicators help traders identify:
-
Breakout opportunities
-
Momentum shifts
-
Reversal patterns
For example, indicators such as Moving Average, RSI, and MACD help traders interpret price behavior quickly.
Why Do Long-Term Investors Prefer Fundamental Analysis?
Long-term investors focus on company growth potential and financial stability.
They analyze:
-
Quarterly earnings reports
-
Industry growth trends
-
Competitive advantages
Strong fundamentals often lead to long-term price appreciation.
Table: Key Financial Metrics Used in Fundamental Analysis
| Metric | Purpose |
|---|---|
| Earnings Per Share (EPS) | Measures company profitability |
| Price to Earnings Ratio (P/E) | Determines stock valuation |
| Return on Equity (ROE) | Measures efficiency of capital |
| Debt to Equity Ratio | Indicates financial stability |
| Revenue Growth | Shows business expansion |
Which Method Predicts Stocks Better?
The answer depends on investment goals and time horizon.
Technical analysis works best for:
-
Short-term trading
-
Intraday strategies
-
Market timing
Fundamental analysis works best for:
-
Long-term investing
-
Value investing
-
Portfolio building
Many successful investors combine both approaches.
Table: When to Use Each Strategy
| Situation | Best Method |
|---|---|
| Intraday trading | Technical analysis |
| Swing trading | Technical analysis |
| Long-term investment | Fundamental analysis |
| Identifying undervalued stocks | Fundamental analysis |
| Entry timing | Technical analysis |
Realistic Case Study: How Combining Both Methods Improved Results
Ravi, an IT professional from Bangalore, began investing in the stock market in 2021.
Initially, he relied only on technical indicators. While he made some profits, many trades failed because he ignored company fundamentals.
Later, he changed his strategy:
1 He screened companies using fundamental analysis to find strong businesses.
2 He used technical analysis to identify the best entry point.
For example, he identified a fundamentally strong technology company with strong earnings growth. Instead of buying immediately, he waited for a technical signal when the stock bounced from a support level.
Within several months, the stock gained significantly, demonstrating the power of combining both approaches.
Lesson:
Using both methods together improves prediction accuracy.
How Professional Investors Combine Both Methods
Modern investors often follow a hybrid strategy.
Example workflow:
1 Use fundamental analysis to shortlist strong companies
2 Use technical analysis to determine entry and exit points
This approach balances long-term value with short-term timing.
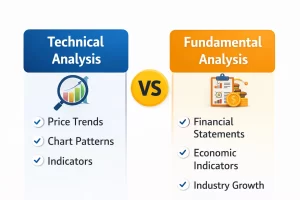
Visual Comparison: Technical vs Fundamental Approach
Technical Analysis
Focus on:
- Price trends
- Chart patterns
- Indicators
Fundamental Analysis
Focus on:
- Financial statements
- Economic indicators
- Industry growth
Internal Linking FinBankingTech
Suggested internal articles:
Top 10 Indicators Used for Stock Price Prediction
How Stock Market Prices Move: Demand, Supply & Market Psychology
AI Stock Price Prediction Using Machine Learning
Best Intraday Trading Strategies
Example anchor text:
“Learn more about chart indicators in our guide Top 10 Indicators Used for Stock Price Prediction.”
Join Our Trading Community
Telegram Updates
https://finbankingtech.com
WhatsApp Support
7905455959
Official Website
https://finbankingtech.com
Frequently Asked Questions
What is the main difference between technical and fundamental analysis?
Technical analysis studies price charts and indicators, while fundamental analysis examines financial statements and economic factors to determine a stock’s intrinsic value.
Which method is better for beginners?
Fundamental analysis is often easier for beginners because it focuses on company performance rather than complex chart patterns.
Do professional traders use technical analysis?
Yes. Most professional traders rely heavily on technical indicators to identify trading opportunities and market trends.
Is fundamental analysis useful for long-term investing?
Yes. Fundamental analysis helps investors identify companies with strong financial performance and long-term growth potential.
Can technical analysis predict stock prices accurately?
Technical analysis helps estimate probability, but it cannot guarantee accurate predictions.
Do hedge funds use both methods?
Yes. Many hedge funds combine technical and fundamental analysis for better decision-making.
What are the most common technical indicators?
Popular indicators include RSI, MACD, Moving Average, Bollinger Bands, and Fibonacci retracement.
What financial statements are used in fundamental analysis?
Investors analyze the income statement, balance sheet, and cash flow statement.
Why do traders prefer charts?
Charts visually represent price movements and help traders identify trends quickly.
Is technical analysis useful for crypto trading?
Yes. Technical analysis is widely used in cryptocurrency markets.
What is intrinsic value in fundamental analysis?
Intrinsic value represents the true worth of a company based on financial performance and future earnings potential.
Can beginners learn technical analysis quickly?
Yes. Basic chart patterns and indicators can be learned within a few weeks of practice.
Do long-term investors ignore charts?
Not always. Some long-term investors use charts to find better entry points.
Which analysis method does Warren Buffett use?
Warren Buffett primarily uses fundamental analysis.
Can technical indicators fail?
Yes. Market volatility and unexpected news can invalidate technical signals.
Is combining both methods recommended?
Yes. Combining technical and fundamental analysis often improves prediction accuracy.
Do institutional investors use technical analysis?
Many institutional traders use technical tools for timing trades.
What is the best strategy for new investors?
A balanced approach combining both methods is often recommended.
Are charts important for stock prediction?
Yes. Charts help visualize market trends and trading opportunities.
Can AI replace technical analysis?
AI systems often incorporate technical indicators and financial data to improve prediction models.
Disclaimer
This article is for educational purposes only and should not be considered financial advice. Stock market investments involve risks, and past performance does not guarantee future results. Investors should conduct their own research or consult a certified financial advisor before making investment decisions.